The car repossession statistics from the past few years show some interesting changes in trends from the past decade. Unfortunately during the research for this post we found quite a few headlines about the “surging” repossession rate, the repo man being “everywhere”, and several sites claiming a repossession rate of 65%, which is just crazy if you actually take a minute to think about it.
To try to add some common sense and real facts into the equation we’ve compiled this post of actual figures with real sources, not just hyperbole.
Despite what some articles say about repossessions, the actual rate for vehicles is lower than the average for the past couple of decades. According to Barron’s this may change over the next few years as purchase prices and average loan amounts did rise during the COVID pandemic, but we have not seen that materialize yet. Until or if it does, it is not realistic to make fantastical claims about the vehicle repossession rate.
2020 to 2022 – Repossession Facts and Figures
In 2022 the estimated number of vehicles repossessed during 2022 is 1.3 Million. This number is estimated by using actuals from January – November and estimating for December based on the prior 10 years worth of data (source: Cox Automotive). To put this in perspective it comes out to:
- 3561 per day
- 148 per hour
- 2.5 per minute
While this may seem like a lot, let’s compare it to new car sales. In 2022 there were approximately 14.1 Million New Cars sold (source – St. Louis Federal Reserve Bank). An additional 36.2 Million used cars were sold in 2022, bringing the total vehicle sales to 47.3 Million. To put this into perspective, this equates to an average of:
- 129,589 per day
- 5,399 per hour
- 90 per minute
This means for every 36 cars sold, on average one financed vehicle on the road is repossessed. This can be any financed vehicle purchased in any year, so the comparison is just to add perspective. The repossession rate compared to car sales is a few percent – not 65%.
Both 2020 and 2021 saw a reduction in both auto loan defaults and repossessions. In fact, 2021 saw the lowest repossession rate in over a decade. This was a result of several factors including:
- Government stimulus,
- Higher used car valuations, and
- Lender delays.
Both repossession rates and volume dropped significantly in 2020 and 2021. In 2021, there were approximately 1.1 Million vehicles repossessed.
Now, let’s look at the data to back these numbers up.
Historical Repossession Facts and Figures
To illustrate the number of repossessions we’ve compiled the chart below using data from Cox Automotive. As shown, the number of vehicles repossessed increased significantly during the 2008-2009 financial crisis and dropped significantly in 2020 and 2021 during the COVID pandemic. According to Cox Automotive, this makes 2019 the last ‘normal’ year to evaluate. We tend to agree.
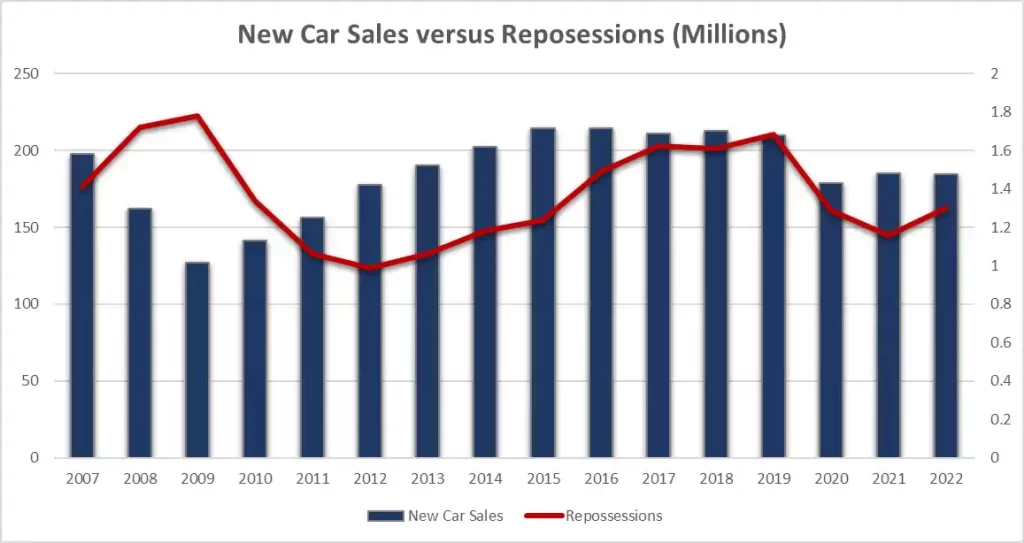
New Car Sales versus Repossessions
Just like vehicle prices, vehicle sales figures are also important to understand. The following chart, using data from the St. Louis FED, shows the total number of vehicles sold over the past decade, versus the number of vehicles repossessed. You can see the affect the 2008-2009 financial crisis had on both numbers. New car sales fell significantly and repossession rose.
Looking at current data, while yes the numbers are increasing, the disparity is no where near that of 2008-2009. In fact, the numbers are returning to normal prior to the pandemic.
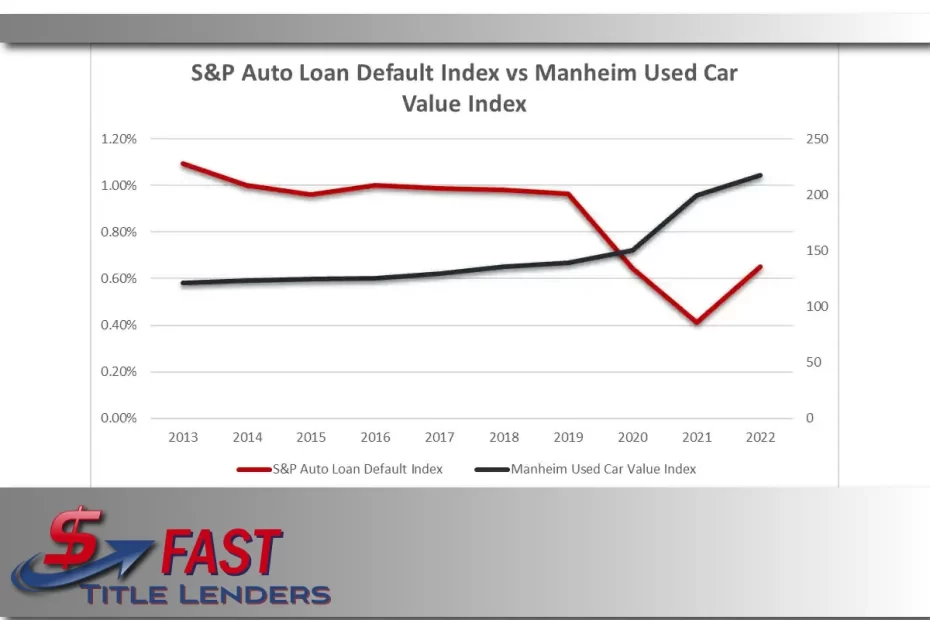
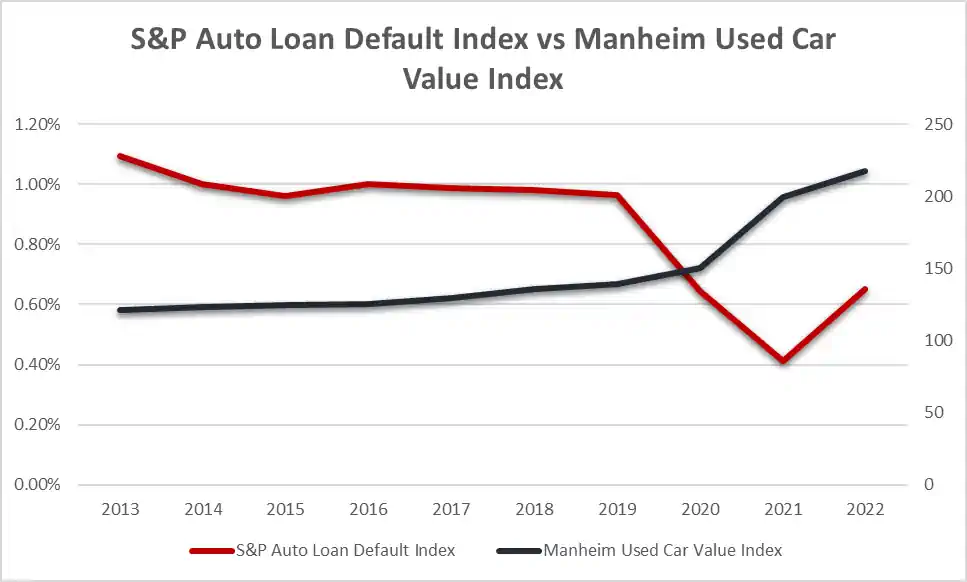
The S&P Auto Loan Default Index illustrates this even clearer by showing how low the default index got in 2021. For the years prior it hovered around 1.0. In the next section the chart shows the S&P Auto Lon Default Index.
Loan Defaults and Used Car Values
Used car values are important for several reasons. Once a new car is purchased it becomes a used car. This means the value has a direct correlation to how much equity you have in a vehicle (if any).
Used cars depreciate (usually). During the COVID pandemic used cars increased significantly which is extremely rare. Looking at the Manheim Used Car Value Index we can see just how dramatic the increase was:
Interest rates are increasing. This means the portion of the loan that goes towards the principal of the loan decreases. The longer the loan, and the larger the principal, means more of the payment goes towards interest.
Add a faster depreciation rate to that and it means more car owners will be ‘underwater’ (owe more than the car is worth). This makes the risk of repossession higher as for some borrowers it may be cheaper to just walk away from the loan.
2023 Repossession Trend Change
Things are changing in 2022. Interest rates are on the rise, and according to Fed Chairman Powell rates will likely continue to rise into 2023. Inflation is at a 41 year high. Car loan payments are increasing and used car values are decreasing.
What does it all mean? In 2023 vehicle repossessions will likely continue to rise, but none of the data shows that this rise is anything other than returning to normal. Interest rates can’t stay at 0% forever.
Summary
2023 may return to normal for car repossessions, or things may get worse. The facts are we certainly haven’t reached that point yet. We’ll keep an eye on the data and update as things change.